Global Electric Mobility Market Research Report – Segmentation By Vehicle Type (Electric Cars, Electric Bicycles & Scooters, Electric Motorcycles, Electric Buses, Electric Trucks), By Propulsion (Battery Electric Vehicle, Plug-in Hybrid, Hybrid), By Component (Battery, Motor, Power Electronics, Charging Infrastructure), By Application (Personal Mobility, Commercial Fleet, Shared Mobility Services), By Region – Forecast (2025 – 2030)
Published: 2025 - June
Report Code: IM-16566
Format:


Region: Global
Market Size and Overview:
The Global Electric Mobility Market was valued at USD 768.56 billion and is projected to reach a market size of USD 2.71 trillion by the end of 2030. Over the forecast period of 2025-2030, the market is projected to grow at a CAGR of 28.7%.
Accelerated EV adoption across passenger vehicles, commercial fleets, and two-/three-wheelers; substantial investment in public and private charging infrastructure; tighter emissions standards in significant countries; and consumer preference shifts toward lower-operating-cost, zero-tailpipe-emission vehicles all support this quick expansion. Government incentives and shared‑mobility solutions expand market reach, but batteries and power‑electronics innovations keep bringing down system costs and increasing range.
Key Market Insights:
Strong acceptance in China (11 million units in 2024), Europe, and North America drove electric cars to make up above 70% of electrified vehicle sales by revenue in 2024.
With India and Southeast Asia spearheading urban mobility conversions, electric scooters and motorcycles in Asia Pacific, which make up 60% of worldwide e-2W/3W sales, are the fastest-growing industry.
Early 2025 saw worldwide public charger installations exceeding 2 million units, rising at 40% YoY, with fast-charger networks growing to satisfy increasing demand from BEVs.
Reflecting urban policies that favor micro-mobility solutions for last-mile connection, shared e-mobility services, e-bikes, e-scooters, and ride-hailing EVs rose 35% in user base in 2024.
Electric Mobility Market Drivers:
The rules and regulations regarding emission levels have now become even stricter, acting as a major market driver too.
Governments around the world have passed stringent CO2-reduction targets that effectively push car manufacturers to electrify their lines. Regulation 2023/851 adopted by the European Union reinforces the 2030 CO2-target to a 55% decrease for autos and demands that all new automobile and van registrations be zero-emission by 2035. Similarly, California's Advanced Clean Cars II rule demands that 100 percent of new light-duty vehicle sales be electric by 2035, with intermediate goals of 35% in 2026 and 68% in 2030. Notwithstanding more initial costs, OEMs must quickly turn to BEVs and PHEVs to evade severe fines and match with net-zero targets as non‑compliance penalties grow, up to €2.5 billion in fines could be faced by EU automakers between 2025–2027. These legislative demands speed infrastructure development, research and development for next-generation drivetrains, and strategic partnerships meant to enlarge EV manufacturing and distribution networks.
The rapid decline in the cost of the battery is also considered a major market growth driver.
Driven by economies of scale, better cell yields, and advances in cathode chemistries, lithium-ion battery-pack pricing has fallen from USD 1,100/kWh in 2015 to a record low of USD 115/kWh by late 2024, a nearly 90% drop. These cost reductions enable mass-market cars to provide ranges greater than 400 km without premium markups and directly translate to reduced EV sticker prices. Share is rapidly growing for chemistries including iron‑phosphate (LFP) and high‑nickel NMC 811, which offer cost‑effective alternatives that increase thermal stability and longevity. Continued R&D expenditures supported by government grants and private financing seek USD 80/kWh pack costs by 2027, therefore narrowing the price gap against internal‑combustion cars and stimulating widespread EV acceptance across income categories.
The latest government incentives and increased spending on infrastructure are important market drivers.
In 2024, governments all around devoted over USD 90 billion in direct EV purchasing incentives, rebates, tax credits, lower registration fees, and earmarked USD 150 billion for charging‑network growth and grid improvements to support electrified transportation. While the EU's Alternative Fuel Infrastructure Regulation demands a public‑charger density of one every 60 km on primary thoroughfares by 2030, the U. S. Inflation Reduction Act gives USD 7,500 in consumer tax credits per EV and up to USD 7.5 billion in charging grants. China's NEV Subsidy Program, though phased down, continues to sponsor vehicle and battery R&D. Together, these incentives have de‑risked charging‑network business cases and reduced actual EV acquisition costs by up to 30% in core markets, therefore stimulating both consumer demand and private investment in fast‑charging and grid‑smart technologies.
The recent electrification of corporate fleets is also considered to be an important market driver.
Driven by reduced EV costs and fleet telematics integration, Boston Consulting Group estimates that up to 30% of all newly purchased urban delivery vehicles will be electric by 2025 to meet ESG requirements and save 20–30% lower total‑cost‑of‑ownership over diesel cars. Food‑delivery services in India and Europe are transforming two‑wheel fleets to e‑scooters to lower operating costs and carbon footprint; together, Amazon, DHL, and UPS have ordered hundreds of thousands of electric vans. Often co-funded by government grants, fleet depots are being outfitted with smart energy management systems and high-capacity chargers to maximize charging schedules and reduce peak-demand expenses, therefore strengthening the financial argument for fleet electrification.
Electric Mobility Market Restraints and Challenges:
The gaps in the charging networks are a huge challenge that is being faced by this market.
Though rural and suburban areas usually have no fast-charging within 50 km, urban centers, where 70–80% of public chargers are clustered, profit from dense networks. For non-urban drivers, this causes significant "range anxiety," which discourages EV adoption in precisely the regions where home charging is more difficult. Many chargers are in use or unavailable 15 to 20% of the time, even in well-served markets, hence undermining reliability views. High installation costs (often USD 150–250 k per station) and grid connection challenges delay new sites. Without coordinated public-private collaborations and simplified permitting, these charging-network gaps will remain a major impediment to mass EV adoption outside major metropolitan corridors.
The strain on the grid capacity is a major drawback of this market, which hampers its performance.
Unmanaged EV charging can force local distribution networks beyond capacity: according to a recent National Grid analysis, unmanaged EV load may reach 30–40% of available feeder capacity during evening peaks by 2030. Transformer and substation loading studies show that simultaneous residential charging raises peak demand by 20–25%, thereby endangering brown-outs and equipment stress unless utilities invest in grid upgrades and smart-charging infrastructure. Although managed-charging programs (V1G) and time-of-use tariffs that shift load to off-peak hours can help to reduce upfront grid reinforcement costs, estimated at USD 150 billion globally by 2030, these call for smart-meter rollouts and consumer engagement efforts. Vehicle-to-Grid (V2G) demonstrations show that bi-directional charging might assist in buffering grid stress, but regulatory frameworks for V2G compensation are in early stages. Without active distribution planning and intelligent charging adoption, EV growth runs the risk of outstripping grid readiness in many areas.
The risk related to the supply of the raw material needed is said to be another market challenge.
Lithium, cobalt, and nickel, critical battery minerals, have concentrated supply chains and geopolitical vulnerabilities endangering production stability. Under net-zero scenarios, the IEA projects demand for nickel to increase sevenfold, cobalt 4-fold, and lithium 13-fold by 2040, hence underlining the need for present mining and processing capacity. The Democratic Republic of Congo accounts for more than 70% of cobalt. Though a limited short-term price effect resulted from current inventories, the country recently expanded its export ban, underlining the clout single-source manufacturers wield. Chinese refiners dominate the processing of all three minerals, which raises questions about supply-chain security and possible export quotas. Though changes toward cobalt‑free chemistries (LFP, high‑manganese NMC) may reduce certain hazards, scaling alternate cathode manufacturing presents its own technical and environmental challenges. Raw-material bottlenecks and price volatility, nickel increased 45% in late 2024, could, in the short term, hamper battery production and sustain high EV prices.
The existence of high initial upfront costs related to this market reduces its adoption rate.
EV sticker prices are still 10–17% more expensive than those of similar ICE cars in important markets, even if total-cost-of-ownership parity is getting close. Mid-2024 saw the average new EV cost USD 56,520 in the United States, a 16.8% premium over USD 48,401 for an ICE vehicle. Likewise, Cox Automotive discovered the EV–ICE price differential in Europe narrowed from €17,500 to €5,000, but still presents a challenge for budget‑minded consumers. Even while financing plans and incentives may somewhat relieve the load, this up‑front delta equals USD 8,000+ more money at acquisition. In emerging markets, where average incomes are lower and credit access is limited, the premium often exceeds 20%, thus slowing down EV penetration. As subsidies phase out, higher capex without immediate perceived value slows consumer decision‑making. To close the price-gap barrier for mainstream adoption, continuous battery‑cost reductions toward USD 80/kWh and more leasing or membership models will be crucial.
Electric Mobility Market Opportunities:
The recent use of second-life battery applications is a good market growth opportunity.
With prices increasing from USD 1.27 billion in 2024 to an expected USD 4.7 billion by 2030 at a 25. 5% CAGR, the market for second-life EV batteries is quickly scaling. Typically retaining 50–80% of their original capacity, retired lithium-ion packs are being utilized in stationary storage systems for microgrids, household backup, and utility-scale grid balancing. Companies like Redwood Materials are leading 12 MW/63 MWh second-life installations for data-center microgrids, showing that reused batteries may provide comparable performance at 20–30% lower expense than new-build systems. Circular‑economy rules and regulatory incentives in Europe and North America now acknowledge second‑life storage under preferential tax rates, therefore speeding up project pipelines. Extending battery asset lifecycles by 5–7 years helps second‑life applications lower carbon footprints, reduce e‑waste, and open new revenue streams for OEMs and energy developers before the 2030 deadline.
The increased use of smart charging and vehicle-to-grid services is helping the market to develop further.
Vehicle‑to‑Grid (V2G) experiments in the Netherlands and Japan have confirmed the revenue models and grid stabilization possibilities of bi‑directional charging. MyWheels' Utrecht implementation combines 500 Renault ZOE and R5 EVs with We Drive Solar bidirectional chargers to allow peak‑demand discharges that boost local grid resiliency, now estimated as a €100 million investment, and produce EUR 1,000+ annually for EV owners. By offering frequency regulation and demand‑response capabilities, JERA's mass V2G deployment in Japan projects annual earnings up to ¥200,000 (USD 1,800) per vehicle. Automakers like Nissan and utilities cooperate on conventional standards; the worldwide V2G market is predicted to expand from USD 3.4 billion in 2024 at a 38% CAGR toward USD 80 billion by 2034. By 2030, V2G is ready to develop into a mainstream grid‑service model as authorities simplify interconnection regulations and bidirectional‑charger prices drop.
The developing nations are acting as the emerging markets, presenting an opportunity for the market to expand its reach.
With USD 1.3 billion in subsidies and ₹20 billion for public fast‑charging stations, the government's goals in India and Latin America are opening up huge virgin markets for e‑micromobility and cost‑effective BEVs. India's PM E‑DRIVE scheme calls for 30% EV sales penetration by 2030, equivalent to 80 million EVs and 50–60% two‑wheelers and three‑wheelers, supported by USD 1.3 billion. E‑2W/3W sales in India rose 48% to 123,362 units; Frost and Sullivan projects 35% two‑wheeler electrification by 2030. Latin American countries are also using rising renewable energy to encourage EV fleets in ride-hail, logistics, and public transportation. These policies are spurring regional manufacturing, finance models (battery leasing), and second-life-battery supply networks, thus positioning emerging markets as the next frontier of inexpensive, high-volume electric mobility.
The emergence of software-defined mobility is bringing new opportunities for the market.
EV use and user experience are changing as Mobility‑as‑a‑Service (MaaS) and smart‑fleet solutions gain ground. Driven by ride-hailing, micromobility integration, and smooth multimodal booking, the global MaaS market, worth USD 453.7 billion in 2024, is projected to reach USD 1,735.9 billion at an 18. 4% CAGR by 2032. At a 10% CAGR, the smart‑fleet‑management market, anchored by IoT telematics, dynamic routing, and charging‑optimization modules, was valued at USD 365 billion in 2022 and is expected to reach USD 960 billion by 2030. Rapidly adopting AI-powered dispatch algorithms that minimize deadheading, plan smart-charging in low-tariff windows, and predict maintenance requirements, fleet operators increase EV uptime and lower the whole cost of ownership by 20–25%. As 5G connectivity and edge computing ripen, software-defined mobility will enable real-time interoperability between vehicles, infrastructure, and energy-management systems, thereby sparking next-gen shared-mobility ecosystems worldwide.
Electric Mobility Market Segmentation:
Market Segmentation: By Vehicle Type
• Electric Cars
• Electric Bicycles & Scooters
• Electric Motorcycles
• Electric Buses
• Electric Trucks
The Electric Cars segment is said to dominate this market. Mass-market models in China, Europe, and North America, where helpful policies and extensive product portfolios fuel volume, make up roughly 70% of worldwide electric vehicle earnings. The Electric Bicycles & Scooters segment is the fastest-growing segment of the market. The sales of E-2W/3W are growing at more than 30% CAGR, particularly in China and Southeast Asia, as urban commuters prefer cheap, last-mile solutions and governments subsidize e-micromobility.
The Electric Motorcycles segment is growing gradually on safety and performance appeals. This segment in Europe and Asia is specialized and premium but restricted by higher price points and licensing needs. The popularity of Electric Buses is accelerating, as 10,000 E-Buses were ordered last year. When it comes to the Electric Trucks segment, high vehicle and battery costs restrict share (approximately 3–5%) even if heavy-duty electrification experiments are developing in logistics and garbage collection.
Market Segmentation: By Propulsion
• Battery Electric Vehicle
• Plug-in Hybrid
• Hybrid
The Battery Electric Vehicle (BEV) segment is said to dominate this market. Led by 65% of the market share, BEVs are supported by declining battery prices, increasing fast‑charger networks, and zero-emission policies in important economies. The Plug-in Hybrid segment is the fastest-growing segment of the market. Growing 25% CAGR, PHEVs provide automakers with a compliance bridge to zero-emission targets and consumers with less range anxiety at less fueling-infrastructure risk. Hybrid electric car (HEV). Valued for small efficiency increases without charging requirements, HEVs keep a 10–15% share in areas with slow charging-network deployment.
Market Segmentation: By Component
• Battery
• Motor
• Power Electronics
• Charging Infrastructure
Here, the Battery segment is said to dominate the market. Since pack cost remains the largest single line item, even as pack prices fall toward USD 100/kWh, battery packs account for roughly 40% of e‑mobility system expenditure. The Charging Infrastructure segment is the fastest-growing one. Driven by deployment objectives (e.g., the EU's 3 million chargers by 2030) and utilities' grid‑modernization initiatives, public and private charger installations are growing at around 35% CAGR. The Electric Motor and Power Electronics segments together account for roughly 30% of component revenues, with consistent double-digit expansion as OEMs maximize drivetrain efficiency and performance.
Market Segmentation: By Application
• Personal Mobility
• Commercial Fleet
• Shared Mobility Services
The Personal Mobility segment is said to dominate the market. Around 60% of sales come from privately owned EVs since individual buyers embrace BEVs and e-2W/3W for daily commutes, driven by incentives and reduced operating expenses. The Commercial Fleet segment is said to be the fastest-growing one. Driven by TCO benefits, 20–30% lower energy and maintenance expenditures over ICE fleets, logistics, and ride-hail companies are electrifying light-commercial vehicles at >30% CAGR. When it comes to the Shared mobility services segment, although accounting for around 10 to 15% of all e-vehicle use, e-moped and e-scooter sharing initiatives in urban areas are growing rapidly and are limited by regional laws and profitability models.
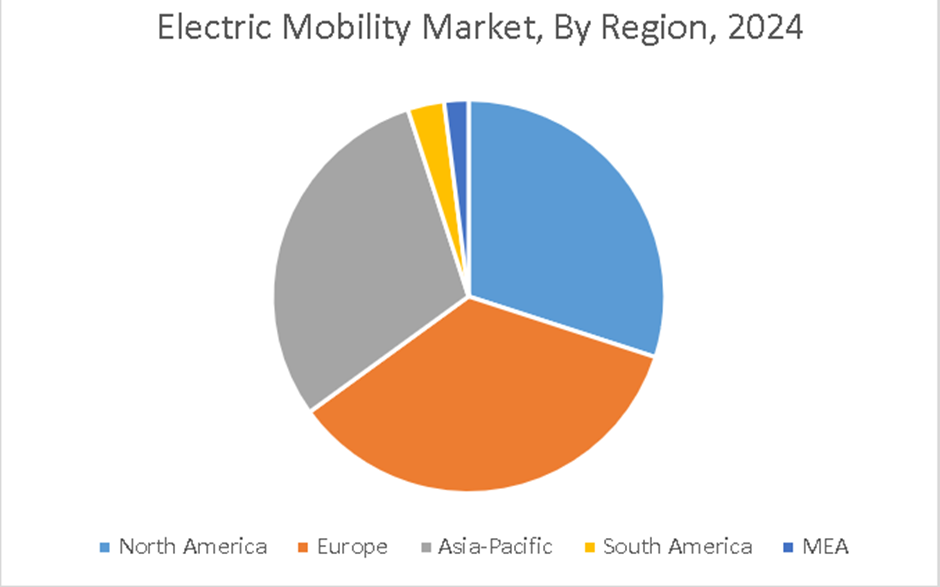
Market Segmentation: By Region
• North America
• Asia-Pacific
• Europe
• South America
• Middle East and Africa
Europe is said to lead the market. Backed by a strong charging infrastructure, nations such as Norway, Germany, and the Netherlands lead the charge for electric vehicle uptake. The Asia-Pacific region is the fastest-growing region. Electric mobility options are also receiving considerable funding from major car companies. Particularly in nations like China, Japan, and India, the Asia-Pacific area is expanding quickly. Fueled by government policies, technical developments, and rising attention on sustainability, China is the biggest market for electric cars worldwide. There is also a rising investment in EV infrastructure in the area.
The North America region is driven by strong government incentives for electric vehicle (EV) adoption, growing consumer awareness, and infrastructure development. North America is a major player in the electric mobility sector. The emerging South American market shows increasing interest in electric mobility alternatives. Though the electric car industry is still underdeveloped in comparison to other areas, countries like Brazil and Argentina are starting to embrace it. For development, government incentives and awareness programs are necessary. Though the MEA region's market is small, electric mobility is attracting more attention as governments and corporations try to lower carbon emissions and better air quality. Although adoption is now modest, future expansion is predicted to be fueled by investments in electric car manufacturing and infrastructure.
COVID-19 Impact Analysis on the Global Electric Mobility Market:
The epidemic broke supply lines, semiconductor shortages postponed vehicle production by 6–9 months, and decreased auto showroom footfall, thereby causing a 12% drop in worldwide EV deliveries in 2020. But a strong resurgence in 2021–2022 was sparked by stimulus packages under the U. S. IRA, EU recovery funds, and China's green‑vehicle subsidies. Furthermore, lockdown-driven urban pollution issues sped policymakers and consumers' attention to zero‑emission mobility, which led to record EV sales, 17 million units sold in 2024, up 14% annually.
Latest Trends/ Developments:
Promising > 500 km range and quicker charging, companies like Toyota and QuantumScape are racing to commercialize SSBs by 2027.
Networks, including Ionity and Electrify America, introduce 350 kW+ chargers that allow for a 10–80% charge in 15 minutes.
Adoption of embedded financial solutions and end-to-end online sales systems has increased 50% to simplify EV purchases.
To lower emissions and relieve congestion, cities like Paris and Shenzhen are testing 30 km/h EV‑only zones and e‑micro‑mobility hubs.
Key Players:
• BMW Motorrad International
• Gogoro, Inc.
• Honda Motor Co. Ltd.
• KTM AG
• Mahindra Group
• Ninebot Ltd.
• Suzuki Motor Corporation
• Terra Motors Corporation
• Vmoto Limited ABN
• Yamaha Motor Company Limited
Chapter 1. Global Electric Mobility Market–Scope & Methodology
1.1. Market Segmentation
1.2. Scope, Assumptions & Limitations
1.3. Research Methodology
1.4. Primary Sources
1.5. Secondary Sources
Chapter 2. Global Electric Mobility Market– Executive Summary
2.1. Market Size & Forecast – (2025 – 2030) ($M/$Bn)
2.2. Key Trends & Insights
2.2.1. Demand Side
2.2.2. Supply Side
2.3. Attractive Investment Propositions
2.4. COVID-19 Impact Analysis
Chapter 3. Global Electric Mobility Market– Competition Scenario
3.1. Market Share Analysis & Company Benchmarking
3.2. Competitive Strategy & Development Scenario
3.3. Competitive Pricing Analysis
3.4. Supplier-Distributor Analysis
Chapter 4. Global Electric Mobility Market Entry Scenario
4.1. Regulatory Scenario
4.2. Case Studies – Key Start-ups
4.3. Customer Analysis
4.4. PESTLE Analysis
4.5. Porters Five Force Model
4.5.1. Bargaining Power of Suppliers
4.5.2. Bargaining Powers of Customers
4.5.3. Threat of New Entrants
4.5.4. Rivalry among Existing Players
4.5.5. Threat of Substitutes
Chapter 5. Global Electric Mobility Market- Landscape
5.1. Value Chain Analysis – Key Stakeholders Impact Analysis
5.2. Market Drivers
5.3. Market Restraints/Challenges
5.4. Market Opportunities
Chapter 6. Global Electric Mobility Market- By Vehicle Type
6.1. Introduction/Key Findings
6.2. Electric Cars
6.3. Electric Bicycles & Scooters
6.4. Electric Motorcycles
6.5. Electric Buses
6.6. Electric Trucks
6.7. Y-O-Y Growth trend Analysis By Vehicle Type
6.8. Absolute $ Opportunity Analysis By Vehicle Type, 2025-2030
Chapter 7. Global Electric Mobility Market– By Propulsion
7.1 Introduction/Key Findings
7.2. Battery Electric Vehicle
7.3. Plug-in Hybrid
7.4. Hybrid
7.5. Y-O-Y Growth trend Analysis By Propulsion
7.6. Absolute $ Opportunity Analysis By Propulsion, 2025-2030
Chapter 8. Global Electric Mobility Market– By Component
8.1. Introduction/Key Findings
8.2. Battery
8.3. Motor
8.4. Power Electronics
8.5. Charging Infrastructure
8.6. Y-O-Y Growth trend Analysis By Component
8.7. Absolute $ Opportunity Analysis By Component, 2025-2030
Chapter 9. Global Electric Mobility Market– By Application
9.1. Introduction/Key Findings
9.2. Personal Mobility
9.3. Commercial Fleet
9.4. Shared Mobility Services
9.5. Y-O-Y Growth trend Analysis By Application
9.6. Absolute $ Opportunity Analysis By Application, 2025-2030
Chapter 10. Global Electric Mobility Market, By Geography – Market Size, Forecast, Trends & Insights
10.1. North America
10.1.1. By Country
10.1.1.1. U.S.A.
10.1.1.2. Canada
10.1.1.3. Mexico
10.1.2. By Vehicle Type
10.1.3. By Propulsion
10.1.4. By Component
10.1.5. By Application
10.1.6. By Region
10.2. Europe
10.2.1. By Country
10.2.1.1. U.K.
10.2.1.2. Germany
10.2.1.3. France
10.2.1.4. Italy
10.2.1.5. Spain
10.2.1.6. Rest of Europe
10.2.2. By Vehicle Type
10.2.3. By Propulsion
10.2.4. By Component
10.2.5. By Application
10.2.5. By Region
10.3. Asia Pacific
10.3.1. By Country
10.3.1.1. China
10.3.1.2. Japan
10.3.1.3. South Korea
10.3.1.4. India
10.3.1.5. Australia & New Zealand
10.3.1.6. Rest of Asia-Pacific
10.3.2. By Vehicle Type
10.3.3. By Propulsion
10.3.4. By Component
10.3.5. By Application
10.3.6. By Region
10.4. South America
10.4.1. By Country
10.4.1.1. Brazil
10.4.1.2. Argentina
10.4.1.3. Colombia
10.4.1.4. Chile
10.4.1.5. Rest of South America
10.4.2. By Vehicle Type
10.4.3. By Propulsion
10.4.4. By Component
10.4.5. By Application
10.4.6. By Region
10.5. Middle East & Africa
10.5.1. By Country
10.5.1.1. United Arab Emirates (UAE)
10.5.1.2. Saudi Arabia
10.5.1.3. Qatar
10.5.1.4. Israel
10.5.1.5. South Africa
10.5.1.6. Nigeria
10.5.1.7. Kenya
10.5.1.8. Egypt
10.5.1.9. Rest of MEA
10.5.2. By Vehicle Type
10.5.3. By Propulsion
10.5.4. By Component
10.5.5. By Application
10.5.6. By Region
Chapter 11. Global Electric Mobility Market– Company Profiles – (Overview, Product Portfolio, Financials, Strategies & Developments, SWOT Analysis)
11.1. BMW Motorrad International
11.2. Gogoro, Inc.
11.3. Honda Motor Co. Ltd.
11.4. KTM AG
11.5. Mahindra Group
11.6. Ninebot Ltd.
11.7. Suzuki Motor Corporation
11.8. Terra Motors Corporation
11.9. Vmoto Limited ABN
11.10. Yamaha Motor Company Limited
Download Sample
Choose License Type
2850
5250
4500
1800
Frequently Asked Questions
The Global Electric Mobility Market was valued at USD 768.56 billion and is projected to reach a market size of USD 2.71 trillion by the end of 2030 with a CAGR of 28.7%.
Here, the Battery Electric Car segment is said to dominate this market. It has a 70% market share. This dominance is driven by the launch of BEV and supportive policies.
With a 28% CAGR driven by incentives for consumers and infrastructure under the U. S. Inflation Reduction Act, North America is the fastest-growing.
While COVID‑19 slowed supply chains and sales dropped in 2020, it also spurred green‑recovery stimulus, driving record EV shipments by 2024.
Charging-network gaps, grid-capacity constraints, raw-material supply risks, and greater initial vehicle costs relative to ICE models are among the major obstacles being faced by this market.


